In the 2015 US Retail Fraud Survey, retailers across the country identified analytics and monitoring as the number one area of need. With the average US retailer experiencing shrinkage at a level comprising 1.3 percent of total sales (resulting in an annual $60 billion loss industry-wide), it’s no wonder that businesses are looking to analytics and big data to help limit this loss.
Given this increased focus on analytics, for the 2016 Retail Industry Leaders Association (RILA) Asset Protection Conference, 7-Eleven partnered with the University of Texas Master of Science in Business Analytics (MSBA) program to better understand the relationship between inventory loss and fraudulent activity. Over the course of four months, our student group worked closely with asset protection experts at 7-Eleven to better understand the intricacies of the business model, formulate hypotheses about store-level fraudulent activity, and evaluate findings from the data analysis to make business recommendations.
Exploratory Research
First, we knew we needed to gain a solid understanding of 7-Eleven’s business before we could use analytics to identify fraudulent activity. After several visits to different 7-Eleven stores to observe inventory audits and perform cycle counts, we discussed the data available to us for analysis with our mentors at 7-Eleven.
7-Eleven currently uses sales reducing activity (SRA) levels as an identifier for fraud. SRA covers a wide range of store activities that are a part of the standard business operations for a 7-Eleven store, including aborts, item voids, price overrides, transactions with discounts, and so forth. While many of the occurrences of these SRA are not tied to fraudulent activity, a store with abnormally high levels of SRA indicates that certain transactions are being misused and abused at that store.
Next, we wanted to collaborate with our mentors at 7-Eleven to come up with hypotheses about how different fraudulent activities could be reflected in the data. Besides SRA, what other metrics could we look at to identify fraud?
Through our discussions, we determined that inventory variation and cash purchases could both be used as fraud indicators. Inventory variation is the periodic difference between the book value of inventory and the actual value of inventory in the store. Inventory shortages (negative inventory variations) can be due to fraud. Cash purchases are inventory purchases by a 7-Eleven franchise on products outside of the standard 7-Eleven assortment. They allow a franchise store to personalize its inventory assortment to its local market.
For example, a 7-Eleven store located near the University of Texas at Austin campus may decide to stock University of Texas sports apparel. Because of this unique business model, cash purchases can be used to commit fraud. For example, a franchisee may leave gross profit off the books by underreporting or not reporting at all certain cash purchases. Additionally, because franchisees bear the full burden of inventory shortages, they can commit fraud by covering up inventory shortages with misreported cash purchases. However, it is important to note that similar to SRA, not all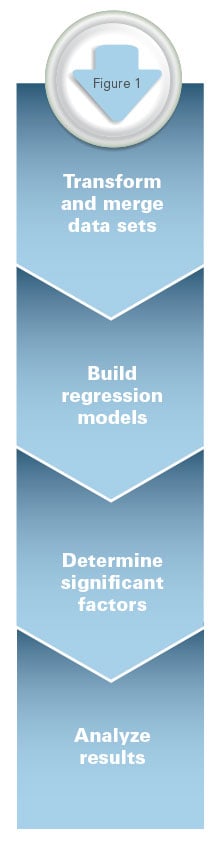 instances of inventory variation and cash purchases are a result of fraud.
Approach
Because not all SRA, inventory variation, and cash purchases are tied to fraudulent activity, we needed to take a methodical approach to untangle the
complexities of the problem and better understand how all of these factors interrelate. Most importantly, we wanted to ensure that the results of our analysis made sense within the context of the business. Specifically, we wanted to filter and hone in on the instances of inventory variation that are caused by fraudulent SRA and the associated cash purchases used to cover them up. To do this, we transformed and merged multiple data sets from 7-Eleven that contained two years of financial and SRA data for stores located in the Texas market. Financial data included store-level sales, profits, inventory levels, cash purchases, and so forth on a monthly basis. SRA data included store-level counts of sales reducing activities, the dollar values associated with these transactions, and the percent of total transactions for each SRA. In total, this amounted to over two million data points. Using techniques such as LASSO and logistic regression in R and Python, we explored the relationship between SRA, inventory variation, and cash purchases and their effects on sales and profitability (see figure 1). Then, we visualized our results using Tableau.
Findings
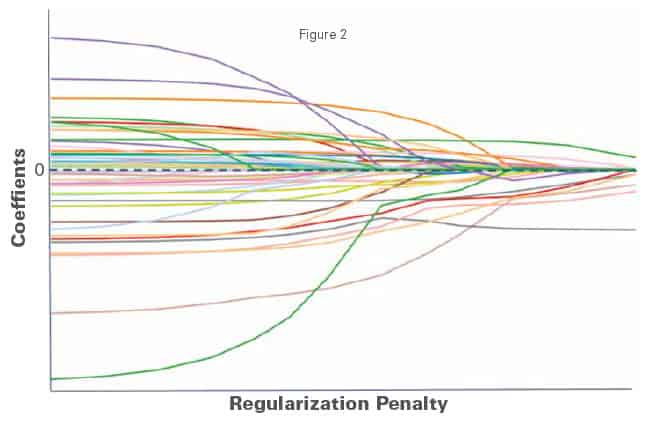
First, we wanted to quantify the financial impact of fraudulent activity on the profitability of 7-Eleven stores. Next, we wanted to untangle the relationship between SRA and inventory variation. Specifically, we aimed to separate the seventy different SRA measures into significant and not significant factors in terms of their correlation with inventory shortage. Using a LASSO (least absolute shrinkage and selection operator) regression, we were able to eliminate factors whose coefficients quickly converged to zero. Out of the original seventy SRA measures, ten were found to be the most important to focus on for identifying fraudulent activity (see figure 2).
After looking at the relationship between SRA and inventory variation, we wanted to understand how all of these risk metrics relate to the sales of a 7-Eleven store. In our attempts to model the sales of a 7-Eleven store, we wanted to be sure to include traditional drivers of sales. Based on our exploratory research, we divided these drivers into two categories: store-specific and month-specific characteristics.
Store-specific characteristics included things like location, age, and size of the store, as well as whether the store sold gasoline and/or alcohol. For example, take two stores that are identical in every way except one is located at a busy intersection and the other is located in a more remote area. We would expect the sales of the store at the busy intersection to be higher than that of the store in the remote area. Month-specific characteristics included things like seasonality of the business, the economy, weather, and company-wide promotions. For example, we would expect to see the sales of stores to be higher in the months in which the economy is doing well and consumers are spending more.
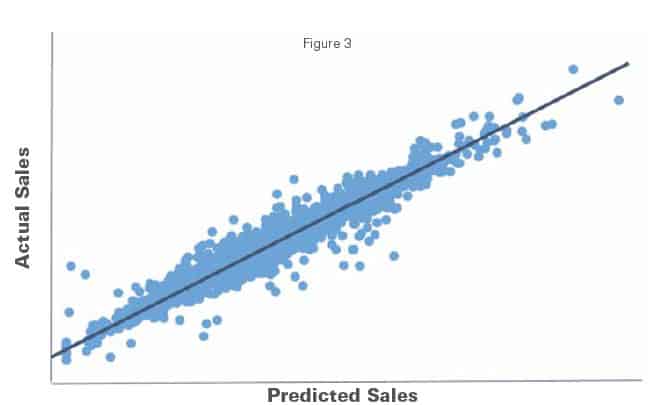
To include all of these sales drivers in our regression model in an efficient way, we used a lagged sales variable to account for store-specific characteristics and time dummy variables to account for month-specific characteristics. From our regression modeling exercise, we were able not only to confirm our hypothesis that inventory variation, cash purchases, and SRA all have negative effects on the overall sales of a 7-Eleven store, but also to quantify exactly how much these risk metrics are correlated with a drop in sales. We felt confident in our findings since the model was able to predict the sales of a 7-Eleven store on a monthly basis with a 3 percent margin of error (see figure 3).
Finally, we shifted our focus to how we could use the analysis to help make business recommendations. Given the fact that 7-Eleven spends a significant amount of time, effort, and money on detecting fraud and taking the appropriate next steps with its asset protection teams, it is important to optimize the AP investment. One way to do this is by prioritizing the fraudulent stores that the 7-Eleven AP teams should pursue.
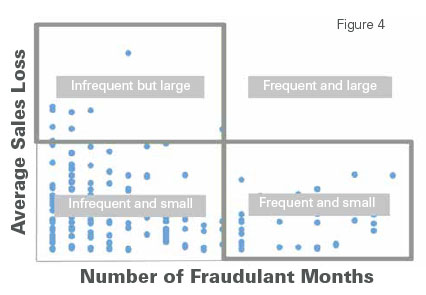
We looked at fraudulent stores in two aspects—the number of months they were believed to have committed fraud and the average associated sales loss when they did commit fraud (see figure 4). When we do this, we see that stores fall into one of three quadrants:
- Stores that committed fraud infrequently resulting in large sales losses;
- Stores that committed fraud infrequently in small amounts; and
- Stores that committed fraud frequently in small amounts.
No stores fell in the quadrant that committed fraud frequently at large levels of sales loss. This exercise clearly shows that 7-Eleven should focus its AP investment on the stores that fall into the first and third quadrants, stores that commit “infrequent but large” fraud and stores that commit “frequent but small” fraud.
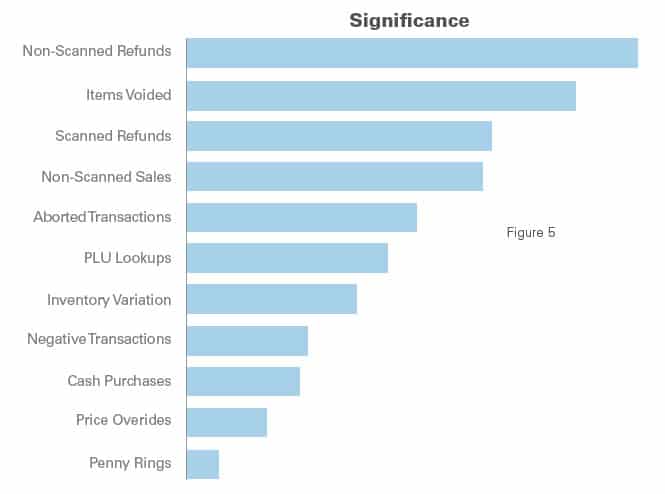
However, in this case, we are classifying fraudulent stores after the fact. To predict which stores are likely to commit particularly flagrant fraud before they do it, we created a logistic regression model that finds the difference between the stores in the quadrants of interest and the stores not in the quadrants of interest. Using this model, we were able to identify the top predictors for our priority fraudulent stores. These predictors include, unsurprisingly, inventory variation, cash purchases, and a subset of SRA measures. Figure 5 shows these predictors ranked in order of their ability to predict whether a store is likely to partake in particularly costly fraud.
Conclusions
By working closely with our mentors at 7-Eleven, our student group was able to leverage big data to find some promising insights into the relationship between inventory loss and fraudulent activity. These insights allowed us to make recommendations on how to prioritize AP spending by focusing on the costliest fraudulent activity. As is the case for all types of analysis, it is important to validate our findings with more data.
Over the course of four months, our student group gained invaluable experience learning how to tackle a significant business problem outside of the classroom using the business analytics skills acquired from our master’s program. As we move forward in our careers, we take from this project a few important learnings—successful data analysis relies on upfront effort to truly understand the intricacies of the business context, the tight-knit collaboration between analysts and business decision makers, and the creativity and resilience to solve the inevitable data issues that arise.
SIDEBAR: Real-World Experience with Real LP Challenges
The Retail Industry Leaders Association (RILA) Student Mentor Program was established to combine skills and insights from academia, a prominent retail chain, and a retail supplier into a semester-long project focusing on a major area of interest for retail loss prevention professionals.
For its sixth year, the program focused on various suspected fraudulent activities that occur in 7-Eleven stores and determining their relationship and impact on reducing profit in those stores. Based in Dallas, Texas, 7-Eleven is the world’s largest convenience store. The retail supplier involved this year was Zebra Retail Solutions, a subsidiary of Zebra Technologies. And the academic partner was the Master of Science in Business Analytics (MBSA) program at the University of Texas McCombs School of Business. Individuals involved included:
- Mark Stinde, Vice President of Loss Prevention, 7-Eleven
- Davina Stevens, Asset Protection Manager, Analytics, 7-Eleven
- Brent Smercynski, Corporate Asset Protection Manager, Operations and Investigations, 7-Eleven
- Art Lazo, Director of Asset Protection, 7-Eleven
- Ed Tonkon, President, Zebra Retail Solutions
- Ben Grisz, MBSA student
- Alexandria Nguyen, MBSA student
- Molly Wolfe, MBSA student
- Michael Zhang, MBSA student
- Lisa LaBruno, Senior Vice President of Retail Operations, RILA
- Kelly Foelber, Manager of Retail Operations, RILA
Michael Hasler, PhD, director of the master’s program at McCombs, has supported the RILA Student Mentor Program for three years. But this year, he made the program a capstone project for these students. In addition to presenting their semester-long capstone project insights—which included applying analytics skills to a data set of over 2 million points of information—the students attended the entire 2016 RILA Asset Protection Conference in April. Top asset protection professionals from retail, including the largest retail chains, met to exhibit, network, and learn with an all-time record attendance of 1,200 participants. The conference provided attendees unprecedented opportunities to connect with peers on the most pressing issues facing the industry today and learn about the innovative technologies transforming asset protection.
The Student Mentor Program’s findings were presented to a packed house of highly interested retail asset protection professionals that included numerous inquiries into both the master’s program and how they might go about hiring one of these freshly minted data scientists. Big data and especially the application of prescriptive analytics was a major theme at this year’s RILA conference. The convergence of e-commerce activity and data-driven business decisions is a major challenge of retailers today all over the world.
“As a major area of interest by our customers, enterprise asset intelligence is being pioneered by Zebra Technologies in order to help make businesses smarter in this connected world we live in,” said Ed Tonkon. “The partnership with RILA, 7-Eleven, Zebra Retail Solutions, and the students from McCombs enabled the conference participants to see the powerful ability harnessing big data can have on a retailer’s business decision making.”