
With the release of the 2024 FBI Crime Report, we’re already seeing the inevitable headlines: “Crime is down!” “The top 10 most dangerous cities in the US!” “Mixed Crime Trends Across Major US Cities.” Even when viewing 2025 crime, similar headlines are popping up with many cities experiencing a decline in violence.
All of these statements are powerful and quickly make their way into news stories and commentary, often supported by national statistics or “experts” in various fields. But, as with most sweeping declarations, the reality is more complex.
Yes, overall crime may be down across the US, but that doesn’t mean crime is down everywhere. In some communities, the decline is clear. In others, crime has remained steady. And in some areas, crime has actually risen. Looking only at national totals, or even city totals, risks missing the local context that matters most—especially to individuals in their daily lives whose perception of crime levels may be very much at odds with the national crime numbers.
Before continuing, let me say clearly: any decrease in crime is a very good thing, and being aware of potentially dangerous places is a smart way to stay safe. But to understand risk more accurately, it’s critical to recognize that no city is completely safe or completely dangerous. Believing a city is risk-free can lead to complacency, while believing it is entirely unsafe can cause people to miss out on opportunities, culture, and community. In both cases, the reality is far more nuanced and worthwhile to investigate and understand.
The real story is in the data. That’s why it helps to look closely at specific cities, like St. Louis, to understand why broad generalizations fall short. Drawing on recent data, we’ll highlight the more complex picture behind the numbers and show why careful, community-based analysis is essential for understanding crime risk.
Show Me Where Crime Is Falling and Where It Is Not: St. Louis Violence
Why St. Louis? I grew up in Illinois and visited St. Louis often as a child, first for Cardinals games and later while attending SIUE and SIUC. Today, when returning to see family, St. Louis is usually either a city we pass through or a meeting place. For this write-up, I was thinking about the city while driving back from the Illinois State Fair (how about that butter cow?)
In addition, two of my colleagues bring additional depth to this discussion as their backgrounds are with the St. Louis Metropolitan Police Department. As a researcher, I can analyze data and identify trends, but pairing those findings with insights from people who know the city’s crime patterns firsthand gives a more accurate picture.
What Does the First Half of 2025 Look Like Compared to 2024?
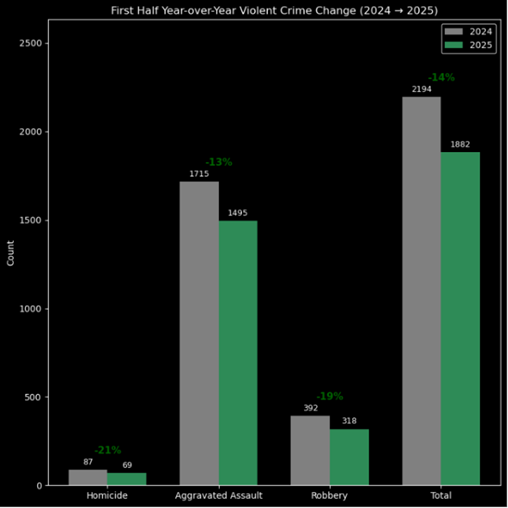
Recent headlines highlight a drop in crime across the United States in 2025. In St. Louis, the first half of 2025 saw substantial declines in violent crime. Homicide, aggravated assault, and robbery each recorded double-digit percentage decreases. Homicide fell by 21 percent compared to the same period in 2024. This represents fewer victims, fewer families affected by violence, and fewer communities disrupted.
Crime trends are influenced by many factors, including policing strategies, community interventions, demographic changes, and economic conditions. For example, the St. Louis Violence Prevention Commission works to expand evidence-based and trauma-informed programs addressing the root causes of violence. While some changes may be temporary, reductions in crime provide tangible benefits to residents, regardless of the underlying reasons.
It is important to interpret these trends carefully. Official crime data only captures reported incidents, so some crimes may go unreported (see NCVS). Homicide, however, provides a more reliable indicator. The 21 percent decline in homicides is significant and encouraging, even while the ratio of law enforcement to residents has dropped over the past decade from 5.54 to 4.41 officers per 1,000 residents.
At the same time, we know crime is not randomly distributed. Reductions are unlikely to be evenly felt across neighborhoods. Some areas may see major improvements, while others experience little change or even increases.
Community-Level Change
CAP Index risk models use Census Block Groups as neighborhood units, offering a consistent way to measure community change. St. Louis has 314 neighborhoods, and Esri’s Crime Analysis Solution provides tools for analyzing changes in violent crime. I also used a Poisson Z-Score approach to determine whether increases or decreases represent statistically meaningful shifts.
Percentage changes can be misleading without context. For example, five neighborhoods show a 400 percent increase in violent crime from 2024 to 2025. Closer examination reveals that four of these went from one incident to five, which is not considered statistically significant. Only one neighborhood saw a jump from two incidents to eight, a meaningful increase.
Neighborhood changes in the first half of 2025 include:
- No violence: 22 neighborhoods recorded no violent crimes
- Stable: 32 neighborhoods saw little to no change
- Decrease: 160 neighborhoods experienced declines, averaging five fewer incidents each, for a total reduction of 787 violent crimes
- Increase: 100 neighborhoods saw increases, averaging about five additional incidents, totaling 475 more crimes
When considering statistical significance, most neighborhoods (82 percent) did not experience meaningful change. In some cases, counts and percentages may seem dramatic but fall within normal variation. Yet, even these smaller changes, once aggregated citywide, help illustrate the larger pattern of declining violence.
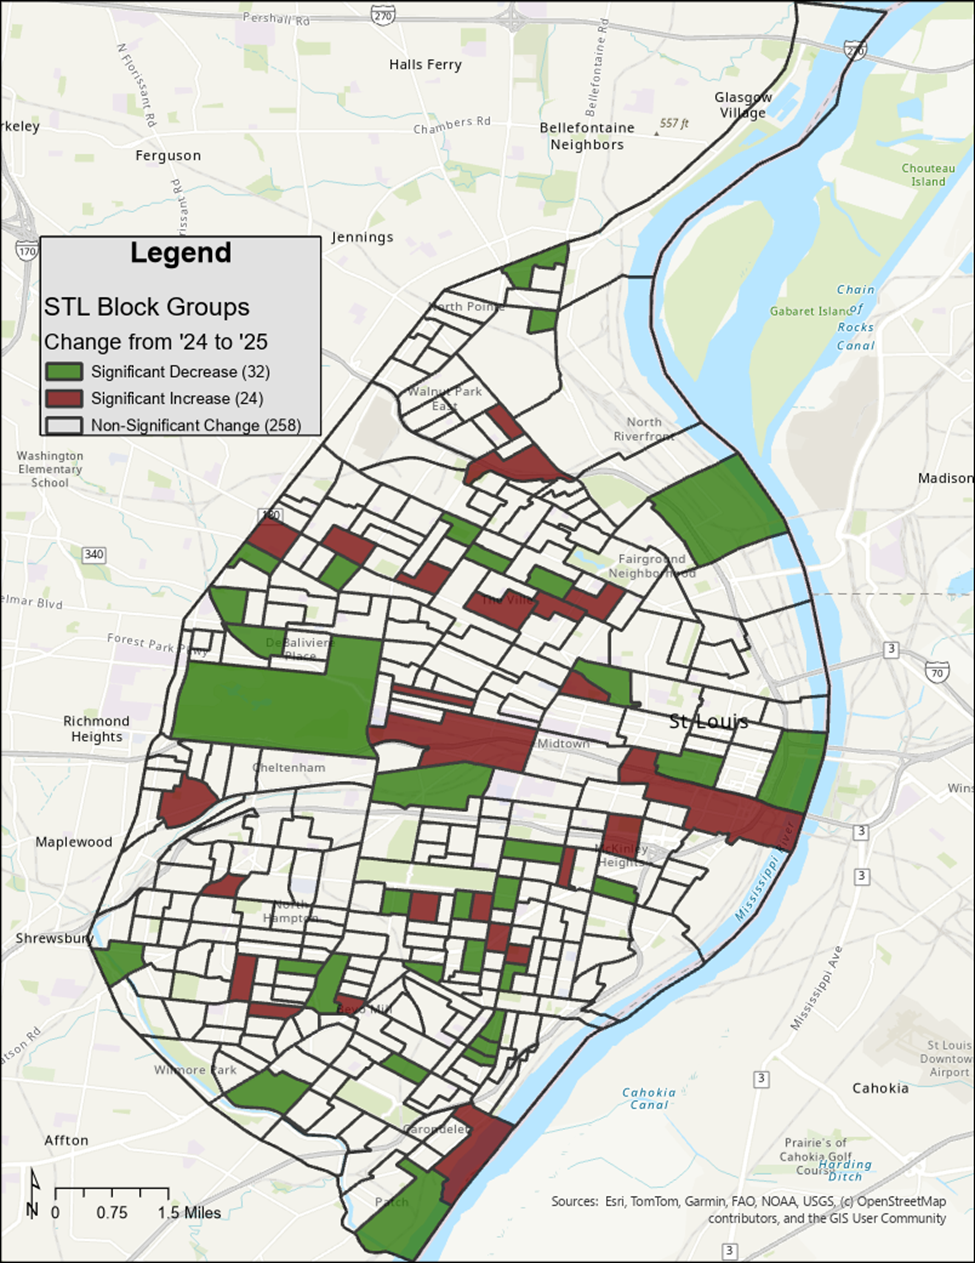
Significant shifts occurred in 56 neighborhoods:
- 32 neighborhoods had substantial declines, dropping from 413 incidents to 93, with the largest single decline being 26 incidents in one neighborhood
- 24 neighborhoods had significant increases, rising from 101 incidents to 341, averaging 10 additional incidents each
The overall balance is positive, but reductions are not evenly spread. The Central Corridor, which has seen major investment in recent years, experienced the most striking changes. Some increases in crime in this area may reflect growth rather than a higher risk per activity, as more people and businesses create more opportunities for crime.
Key Takeaways
Citywide trends only tell part of the story. Community-level analysis shows that the impact of crime varies significantly across neighborhoods, affecting both residents and businesses. While many programs claim success where declines are observed, these claims often go unevaluated. More evidence-based decision-making is needed to determine which interventions are most effective.
Overall, St. Louis shows encouraging declines in violent crime in 2025, but these improvements are unevenly distributed. Residents and stakeholders must consider both citywide trends and neighborhood-level patterns to understand the real landscape of safety.
Looking Ahead
This overview provides a snapshot of crime trends in St. Louis for the first half of 2025, highlighting both citywide improvements and the uneven impact across neighborhoods. A longer, more in-depth brief will be released soon, examining the full data in greater detail, including city and neighbor maps depicting the different statistics described above, and introducing a comprehensive neighborhood-level analysis. This expanded report will provide a clearer picture of where progress is being made, where challenges remain, and how community-level patterns shape overall safety.