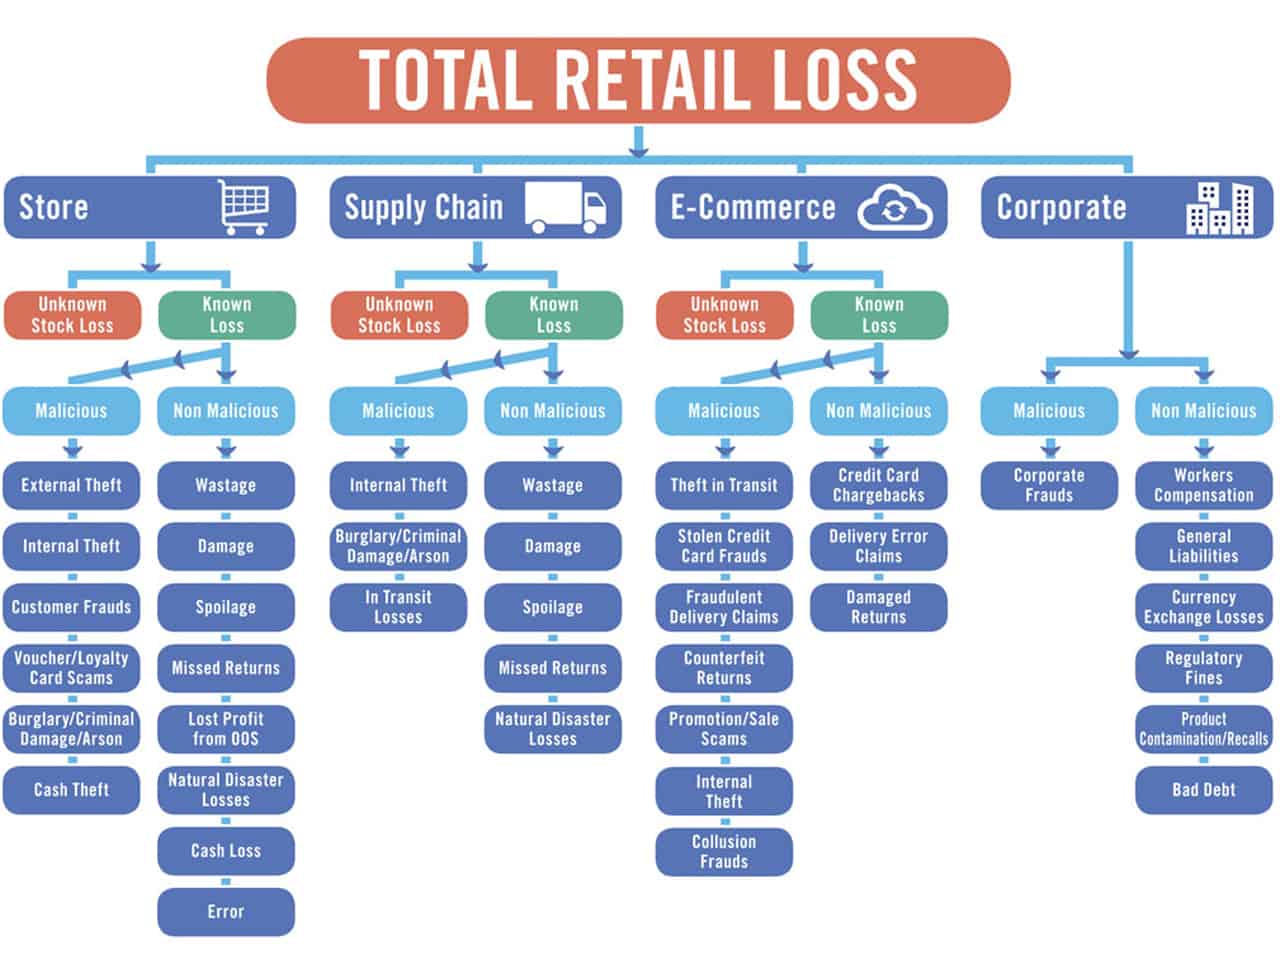
If you are in loss prevention or asset protection, chances are you’ve at least heard of Total Retail Loss (TRL)–a concept coined by Professor Adrian Beck and the Retail Industry Leaders Association to describe the full scope of loss across a retail organization. Its value is undeniable, especially in terms of mapping out the scale of loss within your organization and strategically planning countermeasures.
Like many new business concepts, LP professionals often encounter their fair share of challenges when incorporating TRL into their overall strategy. Here are some of the most common challenges and how to resolve them.
Articulating the Value
As I stated above, TRL is a truly value-added concept in terms of helping teams better coordinate and manage their responses to loss of all types. One of the first challenges professionals encounter in the implementation/deployment process is communicating the value to their leadership. Take a look at the Total Retail Loss chart, which can be found below or in this article by Professor Beck himself.

It shows all 31 categories of “known” losses plus two categories of “unknown” losses. It also splits losses into malicious (done on purpose for one’s own personal interests) and non-malicious (not done on purpose; caused by process gaps and unknown issues). It may seem overwhelming to look at but note the flow of the chart. You likely see some familiar categories but didn’t know what to call them or how to track them. Perhaps you see some types of loss that you tended to slot under more common “umbrella terms” (like shrink). Confusion over how to categorize certain types of loss makes it incredibly difficult to explain them to your team, let alone coordinate a response to them.
This is the approach I recommend when explaining TRL to your leadership team. Help them think of it as a battle plan, of sorts. Take them through the chart and show how it outlines the full scale of loss within your organization, empowering you to divide and conquer. Explain that embracing TRL makes it much easier to identify exactly what activities are cutting into your profits and, by extension, correct them appropriately.
Your leaders will likely question why LP must own the concept of TRL, especially since other functions like supply chain are listed separately. Your answer? Because the LP team is the true hub between merchandising, store operations, supply chain and other functions within the organization. As the owner of most of the data needed to analyze TRL, loss prevention makes the ideal conduit to help mitigate the risk and loss across all the categories. With a bit of tact, your leadership will realize the increased productivity, accuracy and efficacy of LP efforts brought by a TRL-based strategy.
Disorganized, Scattered Data
If you look at each category of loss in the TRL graphic, you may notice that the categories fall under the umbrella of multiple functions. What I mean by that is although you may be in charge of investigating and eliminating all of them, the data in which you can find evidence of them is probably owned by various other functions.
For example, I have met very few organizational LP teams with direct access to supply chain data. The more fortunate teams have supply chain data fed directly into their systems – but most must contend with a huge amount of red tape to be able to access the data and start looking for evidence of TRL. Other categories within the TRL scope that are often either highly guarded or otherwise difficult for LP to obtain include Bad Debts, Missed Returns, and In Transit Losses, among others. Traditionally, LP has only owned the data most directly associated with fraud and risk, like POS.
Perhaps gathering, synchronizing, and analyzing all that additional data sounds like too much work for your team on its own. That’s because you are lacking the right systems. Your team needs to adopt advanced technology to break through the various data silos and analyze everything together to triangulate a root cause and determine what must be fixed and how. I recommend prescriptive analytics. This software solution analyzes data from across functions and determines:
- What is happening.
- Why it happened.
- How much it is costing the business.
- What to do about it.
- Who should do it.
With the help of its advanced artificial intelligence (AI) and machine learning engines and simple data ingestion Application Programming Interface (API) technology, prescriptive analytics analyzes data across all 42 loss categories. It also identifies opportunities for improvement, triangulates the root cause, and issues corrective actions to the right person at the right time, reducing the time to take action, which minimizes the total loss of a given event. Prescriptive analytics is essential for cutting through the huge amounts of data covering the 42 categories of TRL and responding to any loss effectively and efficiently.
Regardless of what business function is suffering from loss, prescriptive analytics determines exactly how to fix it, and who needs to know about it. Although the sheer scale of your LP efforts will increase with the adoption of TRL, prescriptive analytics provides the structure and workflow to manage them and combat TRL. These efforts will elevate the value of your department many times over by increasing revenue and margin across your organization as a whole.
I encourage you to share the concept of TRL with your team and/or leadership. The resulting improvements in your team’s performance will speak for themselves. For more information on prescriptive analytics, visit this site and reach out to my team at fran@zebra.com.


