
Deep inside the data warehouses of companies across the world, billions of dollars are trapped in the subtle variations between the binary 0s and 1s that make up fraud and loss prevention data.
For Retail Industry Leaders Association (RILA) asset protection conference in 2014, JCPenney approached the University of Texas at Austin’s masters of science in business analytics (MSBA) program to identify a way to unleash that value, improve their existing fraud detection techniques, and reduce loss.
The potential to re-conceptualize the way companies approach internal fraud detection through big data and an analytics-driven approach drew us to this field. The granularity of data within the retail industry provides a treasure trove of potential that requires an understanding of retail psychology, marketing, and analytics.
Over the course of our four-month project, we were able to create an approach that could reduce the workload of the JCPenney fraud detection and prevention team by over a month annually.
Although the methods we employed are well established within the insurance industry, until recently the cost of computing and analyzing each transaction posed a paradoxical cost-benefit. However, not only does today’s cost of computing sit at record lows, but open-source, freely available software allows companies to pilot robust data analysis with little to no risk. In fact, as McKinsey Global Institute has reported, the chief challenge for companies today in implementing analytics is more in their ability to attract and retain data professionals.
With that in mind, our MSBA team decided to walk through the steps of developing a  model and highlight the importance of domain knowledge experts in developing robust data-driven processes.
“We allowed the graduate team from the McCombs School to analyze loss prevention data sets without bias or preconception,” said Mark VanBeest, CFI, former director of global security and investigations for JCPenney. “Initially, we tasked the students to determine if we were getting the best results on case leads sent to the field. At the time, we were confident that current reports and data were identifying the bulk of our internal theft.”
VanBeest added, “Given the sensitive nature of data security and the critical importance of protecting consumer data, it’s important to note that no consumer credit card information was analyzed or shared with the students for this research project.”
The Focus of Analysis
Using the point-of-sale (POS) reporting system data from JCPenney, our team decided to dive into the “item-delete” report that calculated the delete ratio and triggered emails to stores every week. From there, store-level loss prevention personnel were provided a focus to investigate potentially fraudulent activity. Unfortunately, there was a difficulty in determining the success reports because the system only required stores to report back with “true” fraudulent activity. In other words, if no call back was made to corporate in response to the reported list of “potentially fraudulent” item deletes, the report presumed that they were actually non-fraudulent. However, that presumes that every single item within the report was investigated, which, pragmatically, is unrealistic.
To gain a better understanding of the data and how to go about modeling fraudulent transactions, our team began by computing some descriptive statistics for our data. More specifically, we uncovered that for the current delete ratio of 2, which indicated the number of deleted items was half or more of that total number of scanned items for a given receipt, out of our sample of 158,000 reported transactions, we found that only around 1 percent came back as actual fraud.
That posed a unique challenge in that the existing fraud-threshold reported so many transactions that it became almost infeasible to perform a loss prevention investigation for all of them. With that in mind, we focused on answering two questions:
- Is the report worth sending out?
- If so, how do we more accurately predict fraud to reduce the number of flagged transactions and the workload of the LP associate?
This all had to be weighted by the fact that reducing the list too far would allow fraudulent transactions to pass through and cost the company money.
Our approach was to use logistic regression to improve the investigation reporting threshold by creating a model that output a likelihood of fraud associated with each exception. With that prediction, we could rank order each transaction, determine a new threshold to cull weekly emails, and provide a prioritized list to loss prevention leaders.
Here is a simple explanation of how logistic regression works. Graph A shows the linear regression of the observed probabilities (Y) on the independent variable X. The problem with ordinary linear regression in a situation like this is if the regression line is extended a few units upward or downward along the X axis, you will end up with predicted probabilities that fall outside the legitimate probability range of 0 to 1. As shown in Graph B, logistic regression fits the relationship between X and Y with a special S-shaped curve that is constrained to remain within the range of 0 to 1 on the Y axis.

Assumptions and Data Analysis
Our study is based on over 158,000 exceptions reported on the item-delete report generated from November 2013 to February 2014. The information associated with each of the exceptions included attributes such as the employee ID, location, date, quantity deleted, and other data. Whether an exception was confirmed to be a true fraud was also indicated.
In order to formulate the problem, JCPenney and our team agreed on a few assumptions. The first assumption was that if an employee was eventually fired for fraudulent actions, most of the previous flagged exceptions were also fraudulent. The second assumption was that the results from our study could be extrapolated from four months to a year to calculate final yearly return on investment (ROI).
Descriptive Analysis. Before jumping into the modeling process, several descriptive statistics were conducted to obtain an understanding of the exception data. While most of the descriptive statistics helped to hone our intuitive expectation of the data, a number of things stood out. The most surprising came when we created a histogram between the number of exceptions and the date of the exceptions, as shown in Figure 2.

The upper half included the non-fraud exceptions, and the lower part included the fraud exceptions. An obvious division can be identified in the histogram. Comparing the two graphs from left to right, we see that they are highly similar up to the gray vertical line. At that point, the level of fraud deviates from the non-fraud distribution. As we can see by the time-series data, the distribution before the gray line represents the holiday season of November and December 2013, whereas after the split represents January to February 2014.
This huge change in seasonality could serve as a detriment to our model, as it doesn’t follow a consistent pattern. In recognition of this, we adapted our original plan from creating a single model to creating two separate models, one for the holiday season and another for the normal shopping season as represented by the January–February timeframe.
Important Attributes Identification. Unfortunately, not all attributes—also known as factors, variables, the “columns” in Excel—are created equally. Instead, some are more informative than others. Before we began building the final model, we needed to see which attributes were actually indicative of fraud.
JCPenney reports seventeen attributes for every exception, including such items as store ID, date, and transaction amount. JCPenney also developed an attribute to measure the risk level of each exception. Exceptions were categorized into “risk” and “high-risk” levels. Our goal was to reduce the complexity of the model and improve the interpretability. With that in mind, we proceeded to identify the statistically significant attributes.
Our first method was to run each of the seventeen attributes individually through a logistic regression; through which, the model indicated if the attribute was statistically significant in determining fraud.
Extending the logistic regression, we also used a second technique called LASSO that provided a ranked list of all the attributes in order of relative importance.
Combining the results of the logistic regression and LASSO regression, six attributes for each shopping season were selected out of the original seventeen attributes.
Interestingly, we confirmed fraud is also influenced by seasonality. By comparing the attribute significance levels of the holiday season model and the normal shopping season model, we found that there were significant differences in terms of importance of attributes predicting fraud.
Modeling of Exception Fraud Probability. Two binary logistic regression models were built, one for each shopping season. The six identified important attributes were input into their season’s model and an estimated probability of fraud would be produced for each exception.
We also implemented a more advanced model to compare the performance of different techniques and the tradeoff between model complexity and performance. The Alpha Decision Tree is an advanced version of a simple decision tree.
A decision tree is a modeling technique that can split the entire exception set into subgroups based on certain criteria. Exceptions in the same subgroup will have similar properties. A ratio of fraud exceptions to the total was then calculated for each subgroup. This ratio was used to estimate the probability of fraud if an exception belongs to that subgroup.
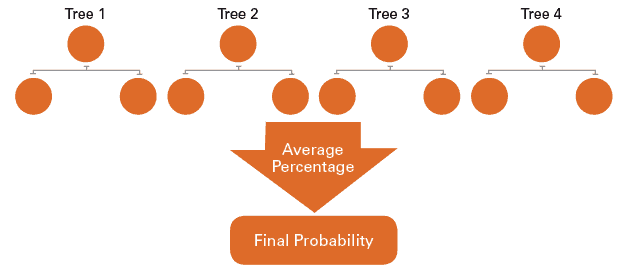
The advanced part of the technique is that, instead of using a single tree model, we developed eight different decision trees. The average prediction will be used to estimate the probability of fraud for each exception. Figure 3 is a simplified graphic demonstrating our approach. Research has proven that combining results from multiple models that are equally good, but diverse, will result in better accuracy and performance. The rationale behind this approach is similar to the idea that higher synergy can be achieved by combining diverse smart minds.
Once we output a probability associated with an exception, each probability was weighted by total dollar amount associated with the transaction. These new weighted probabilities were then reordered from highest to lowest so our model would target the most likely to be fraudulent (and valuable) first.
Modeling Technique and Clarification. It is beneficial to remember that we created three different models, a binary logistic regression for the holiday season, a binary logistic regression for the normal season, and an alpha three classification model that was applied over all the data. It is also important to point out that the data was divided in two parts for this project—a randomly selected training set (70 percent of the exceptions) that was used to construct the models and a test set (30 percent of the exceptions) that was used to measure the accuracy and performance of the models.
Data Analysis Results
To evaluate our new loss prevention investigation models, we needed to compare our results against the results from the current system used by JCPenney. The most easily understandable way to compare our new model with JCPenney’s old system was to fix a number of true fraud exceptions that we want to detect. By holding this number constant, we would be able to compare the models at two different angles, in terms of both work-load reduction and cumulative dollar amount. We decided to include the old and new models that were capable of identifying 70 percent of the fraud exceptions.
To detect the 70 percent of the true fraud exceptions—those that were predicted fraud and proven to actually be fraud—on the holiday season, our binary logistic regression model would require 20,000 exceptions to be investigated. Whereas, JCPenney’s existing system would have required over 24,000 transactions to be investigated to detect 70 percent of the true fraud exceptions. In other words, our binary logistic model could reduce loss prevention investigation workload by 17 percent. In terms of dollar amount for our holiday model, of those 20,000 exceptions needed to reach the 70 percent of true fraud exceptions, we were able to detect $42,000 related to true fraud activity. This amount is approximately 11 percent more than the current system is capable of detecting.

A similar comparison over the normal season, our binary logistic regression needs to study 7,000 exceptions to reach the goal of 70 percent true fraud exceptions. That number is 2,000 less than the number of exceptions that the current system needs, which represents a reduction in workload of 17 percent over this season. Our proposed analytical approach shows about a 17 percent bump in the cumulative amount of dollars related with fraud detected, detecting $1,000 more than the current system.
Finally, the alpha tree model shows a reduction of 27 percent of the total workload between November and January, needing only 24,000 of exception to detect the 70 percent of the true fraud exceptions. Analyzing this amount of exceptions, the model was capable to detect $56,000, or 27 percent more cumulative dollars than the current loss prevention investigation system. As the results show, the analytical approach proposed will help in all the scenarios to reduce the workload needed to achieve the results and improve the amount of dollars related to fraud that the system is capable of detecting.
“During data analysis by the students, some interesting findings emerged,” explained VanBeest. “The research did not uncover anything we were missing but rather identified that we could send fewer case leads while achieving better results. This was a remarkable breakthrough that really made us reevaluate our POS case referral process.”
Research Recommendations
Based on our results, we developed a set of loss prevention investigation recommendations for JCPenney, which are also applicable to any company looking to improve in this area.
First, create a separate fraud detection model for each shopping season. By doing this, we were able to create models that better fit the characteristics of transactions during this time period. Further, examine your data and separate based on the natural changes in patterns within the distribution.
Second, we encouraged JCPenney to rank the exceptions based on an exception’s probability to be fraudulent instead of using a fixed threshold. As our results show, the most improvement in loss prevention investigation workload reduction and largest amount of dollars recovered were provided by the probability ranking system, regardless of the model to which it was applied. In addition to the best performance and possibly the most important finding in this study, the probability ranking provides a dynamic method that could be adapted to specific situations within the company and the season. The fraud detection team could reset the probability threshold to target only exceptions that are predicted to be 80 percent or more likely to be fraudulent during high-transaction seasons, while during low-transaction seasons the threshold could be set to target more. This is a powerful advantage because we can tailor our reports to reflect the amount of time needed for the loss prevention investigation. Hopefully, this would increase the trust and usefulness of the reporting system.
Third, understand which attributes are important in detecting a fraudulent transaction. In this study, we implemented this by using the LASSO regression and the simple regression over the data before building any models. After the analysis, we were able to conclude the current system was based on a statistically insignificant attribute—delete ratio. In fact, the attribute was thrown out, reducing computational complexity and time needed to run the model. An analysis of this sort should be applied over other reports to determine if there are other statistically insignificant thresholds in use.
Fourth, based on the data provided and extrapolating the results over a calendar year of twelve months, this statistical modeling technique will reduce the exception load of the reports by 70,500 exceptions per year. This number of exceptions represents a workload of four weeks for an employee within this area. It was our recommendation that JCPenney implement a system such as the one we created.
Finally, we recommended that the study should be performed using year-long data in order to identify all the seasons, evaluate the list of important attributes, generate a model to each of them, and rank the exceptions based on probability. This would provide a robust system that works more efficiently and more accurately.
Of course, as the report becomes more used, we would hope that the LP professionals would gain faith in the report and potentially report more actual fraud. Fortunately, using the steps outlined above, we could quickly rerun the model with new data and potentially improve further.
In hindsight, from completing this project and presenting our results at the RILA conference, we have come to see the huge potential for this kind of study in the retail world, especially as regards fraud prevention technqiues and loss prevention investigations. The amount of data available is limitless and full of hidden, but important, patterns that can be used to detect fraud.
The beauty of this project is the marriage of analytics and direct business outcome. Unlike many pure statisticians or software engineers, analytics professionals must focus on realizing business value. Fortunately, with a little bit of cleaning, data mining, and critical interpretation, businesses can transform mountains of data into improved margins.
More importantly, as companies everywhere race to implement data analytics, the initiatives will move from a boost in efficiency to a competitive necessity. Fortunately, with such huge bottom-line improvements and commodity computing available, data analytics has never been faster or more accessible.
“Using the findings from this exercise, we were able to streamline our operation and generate fewer unsubstantiated case leads, all while maintaining high performance,” said VanBleest.
SIDEBAR: Big Data and Retail
[this section provided by Ed Tonkon, president, Zebra Retail Solutions]
Big data is a huge topic in retail. This project was an example of the broader retail community working together. This included the vision of RILA’s Lisa LaBruno and their Student Mentor program, the generosity and guidance of Stan Welch and his LP team at JCPenney, and the direction and engagement of Dr. Greg Hallman and Dr. Mike Hasler, the two program directors at the McCombs School of Business at the University of Texas at Austin.
Business analytics is the science of translating vast amounts of complex data into clear, manageable information in order to make sound decisions. The Department of Information, Risk, and Operations Management (IROM) in the McCombs School developed the master of science degree in business analytics to fulfill a significant market need for individuals with deep analytical talent for dealing with the complexities and possibilities of big data in the business and organizational context. The program focuses on students with exceptional quantitative, technical, and communication skills and combines classroom experiences in statistics, data mining, and programming with functional applications such as marketing, social media, and supply-chain analytics.
The students involved in the research reported in this article were not only impressive in their work but also appreciative to be presenters at the RILA asset protection conference and enjoyed networking with professionals in the retail LP industry.
It was an extraordinary experience for me to serve as mentor and co-sponsor for our company. I am hopeful that this inspires greater collaboration for the support of the retail community and academia.
To learn more about this program, visit mccombs.utexas.edu/business-analytics.aspx.
This article was originally published in 2014 and was updated February 5, 2018.