
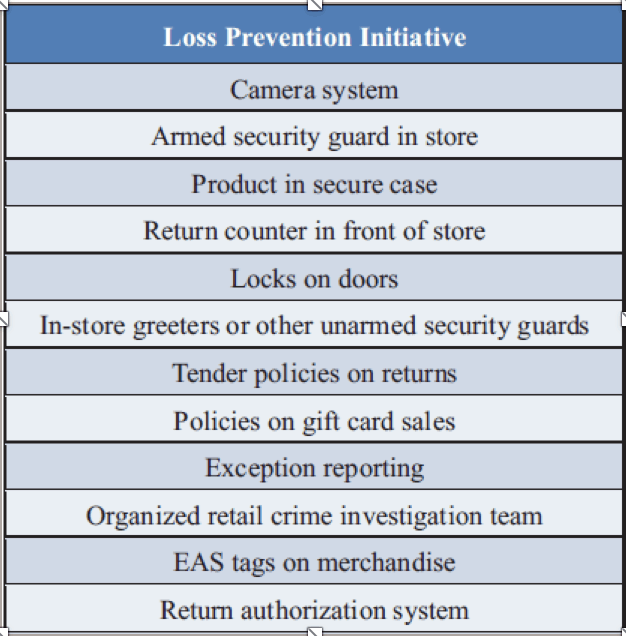
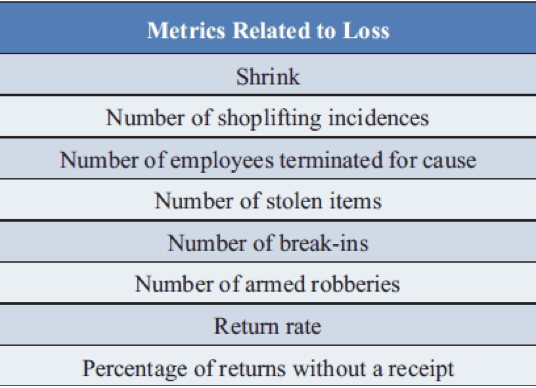
The purpose of many loss prevention programs is to reduce shrink, reduce returns, and lower other negative sales impacting activities. It is important, when designing an experiment and measuring the results, to take a holistic approach and determine a wide range of positive and negative indicators of success or failure.
While we will want to see the corresponding loss-related metrics improve with the implementation of a loss prevention program, we should be equally focused on not impacting core sales. See Figures 1 and 2 for lists of LP initiative and metrics related to shrink.
Experimental Design
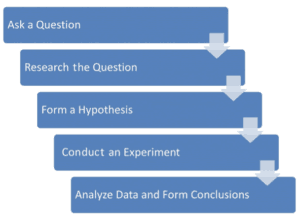
Figure 3 illustrates the normal flow in the scientific method’s process. First, the researcher asks a question. An example question is, “Why do the iPads in the display area of the store continue to get stolen?”
Next, the loss prevention professional researches the question. For example, an inspection of the display area in the store may reveal that the iPads are only secured to the table with a very weak device that can be easily bypassed.
Next, the loss prevention professional would form a hypothesis: “iPads that are secured to the table with a more secure device will not get stolen as often.” At this point in the scientific method, an experiment should be conducted to determine whether the hypothesis is correct.
Many factors can hinder or ensure a complete and accurate experiment. For example, how many records (sample size) you have in the experiment can influence your results and how you can interpret them. For an ideal experiment, it is recommended to have a large number of experimental records, and that the test subjects (can be employees or stores, for example) are representative of the entire population you are trying to investigate. The best way to ensure “representation” is using a random selection of subjects.
For the ideal experiment, it is important to have a control group (those not receiving the test factor – or the thing you are trying to test). It is essential that the test factor is applied as it is planned to be deployed, and that the test factor is the only difference between the test subjects and the control subjects. Again, the assignment of the subjects into “test” versus “control” is best done randomly. Once the subjects are assigned, it is important that the subjects do not know to which group they have been assigned.
Once the subjects have been selected and assigned, it is the time to collect data. Again, the data collection process is also guided by principles that ensure experimental validity. Proper analytical techniques are then required to correctly analyze the data and interpret the results.
Loss Prevention Experiments: Issues to Consider
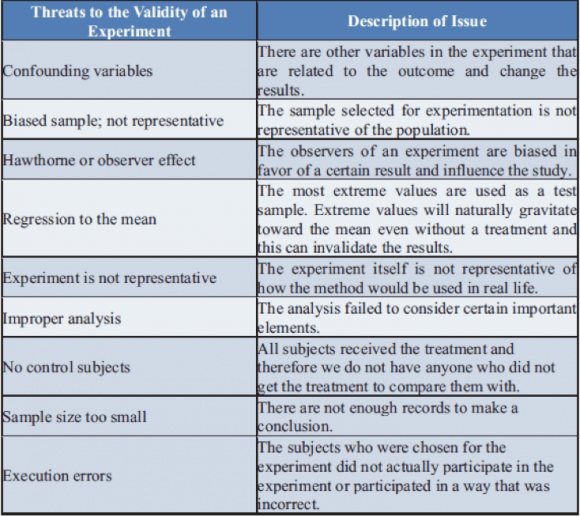
When conducting an experiment, the primary goal is to answer the research hypothesis without any doubt as to the validity of your experiment. Figure 4 shows some common threats to experimental validity. Each of these items can interfere with an experiment and make the results and conclusions unreliable.
When testing loss prevention programs, it is important that only one factor in the store is changed at a time. Additionally, whenever possible, the stores should be assigned to test and control groups randomly so that all other potential confounding variables will be distributed equally in both the test and the control groups.
Suppose that you were attempting to measure the effects of a more secure device to prevent loss of iPads. If, at the same time as your experiment, there were a separate initiative that placed a guard in the area with the iPads. This would be a confounding factor, which would make measuring the effects of the more secure device impossible. Since both prevention factors are present at the same time in the same stores, it will be impossible to separate the effects of the guard from the effects of the more secure devices.
A potential threat to an experiment’s validity and the conclusions from the experiment is improper or incomplete analysis. If the wrong statistical tests are used, if confounding variables that should have been considered are not considered, or if another explanation for the effect was not analyzed, then the results may be invalid. To avoid validity issues with improper analysis, confounding variables, seasonality, open and closing stores, control stores, and proper statistical tests should be used in the analysis.
Even if a proposed hypothesis is true, without an adequate sample size, we may not be able to prove the hypothesis (and reject the null hypothesis in the statistical test). The null hypothesis is the opposite of what you are trying to prove. This becomes increasingly important when the size of the effect is small. For example, suppose we are trying to detect whether shrink has decreased. With only ten stores in a sample and with the natural variation of shrink, we will be unable to detect small changes in shrink due to natural fluctuations in the data. However, if we use 100 stores, this will probably overcome the variation in shrink.
The goal of an experiment and an analysis is to determine whether the loss prevention initiative creates value beyond the cost of the program. To measure return on investment, we first need to analyze the data in a manner that accounts for seasonality and normal data fluctuations. For this reason, we would measure the shrink rate in the test stores and control stores before the test, during the test, and during the same two periods in the previous year. Let’s assume, for this test, that we can obtain shrink within a specific time window using a manual method of measurement.
Once the experiment is completed, an analysis should be conducted to measure the impact of the new loss prevention program on the key metrics. A few key factors should be addressed in the analysis, which are unique to retail:
1) Seasonality – a key reason to use a control sample is seasonality. Most retailers have very different sales and loss patterns depending on the time of the year. There are a few techniques that we can use in the analysis to protect against seasonal fluctuations falsely influencing results.
2) Year-over-year trends – before the test, if stores are trending higher or lower on a key metric year over year just before the test, it may be important to consider these trends in the analysis. A way to deal with both the year-over-year trends and seasonality is to use the following metric for each store. Each store in the test and control sample converted to this measurement captures the net change in the key metric considering trends before and during the test compared with the prior year.
If the results of the experiment are good, and the program is to be rolled out to all stores for a retailer, there are some rollout considerations. The program should be executed similarly to how it was executed for the test. It is also important to establish execution reports to determine whether the program is being executed properly as the program matures. If ongoing measurement is required, it may be useful to maintain a control group of stores that never get the program and can be used as a baseline group for comparison. Alternatively, the program’s removal can be tested at some point. The means that for some period, the program is removed from a random sample of stores and now our test program is the removal of the program. This type of test would be conducted like the original test but in reverse.
In conclusion, the processes for conducting experiments in this article should help the loss prevention professional test and evaluate which programs will have the greatest effect in controlling losses.
EDITOR’S NOTE: This post has been excerpted/adapted from the authors’ text, Essentials of Modeling and Analytics: Retail Risk Management and Asset Protection. Learn more.