
The session took place on the second day of the conference and used an established technology that enabled individual delegates to “answer” questions in real time put forward by the presenters. The results were then immediately displayed to the audience for review and consideration. At the beginning, delegates were given the opportunity to complete two demographic questions—which part of the retail sector did they work, including mass merchandiser, grocery, big-box specialty, small-box specialty, and other; and their position within the business, including corporate management, field, safety/risk management, and other. It was thought these categories would provide additional opportunities for data analysis.
Outlined below are the results from this session. Clearly, caution needs to be taken in interpreting this data as no effort was made to control the sampling of those taking part; it was simply those who decided to attend the session. In addition, it is highly likely that companies sending multiple attendees will be over represented. It is also possible that nonretailers took part. Given the nature of the sample, it was not possible to carry out any statistical tests to analyze whether the differences between groups of retailers or the position of the respondents was statistically significant or not. However, we feel that it has been an instructive exercise and has certainly raised issues about possible future ways of collecting data from the industry.
Inevitably, the number of responses to each question varied between 204 and 225, and the data has, for the most part, been considered by type of retailer. Not all the data collected is presented here and if any reader would like the full data set from the RILA session, then please contact one of the authors. Given time constraints, the session could only address two main themes—the scale and nature of the problem and emerging issues.
Scale of the Problem
Comparing Shrink Rate. The first question asked the audience to compare their shrinkage number (as a percentage of retail sales at retail prices) with the most recent average from the National Retail Security Survey (NRSS) study carried out by the University of Florida, which is 1.59 percent.
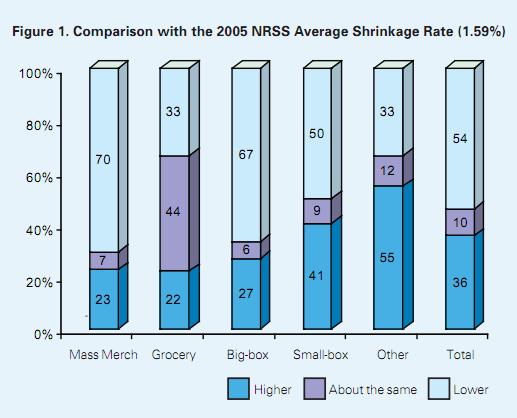
Overall, the majority of retailers thought that their company’s rate of loss was lower than the NRSS average (54%), with one in ten thinking it had stayed the same and just over one-third thinking that it had gotten worse (36%). Mass merchandising and big-box specialty respondents were the most positive, with over two-thirds indicating that their shrink was lower than the average. The grocery sector felt they were most aligned with the NRSS data, with 44 percent suggesting their rate was about the same as the average. Small-box specialty retailers were the group most likely to think that their rate of shrinkage was generally higher than the NRSS rate, with 41 percent choosing this option.
The results seem to suggest that the larger format retail operations have generally lower shrink than their smaller, specialty-format brethren. One can speculate the causes of this could be having a larger sales base to factor the losses against, thereby resulting in a lower percentage-to-sales ratio. Of course, others might contend that the larger operations have the opportunity to employ dedicated loss prevention staff and so provide a more controlled environment.

Another inference from the above data would be the fact that the minority of organizations that are “higher than average” are much higher than average and, therefore, counteract the majority of those retailers who are at or below the industry norm.
Shrinkage Improvement. Respondents were then asked to give their impression of whether the rate of shrinkage in their businesses was improving, remaining steady, or getting worse. This was especially interesting in that many, if not most, of the attendees had just gone through a physical inventory process in the previous two months and the results from this question might provide a snapshot of the current trend.
Responses to this question produced a very split interpretation. The largest proportion felt that the problem of shrinkage was getting worse (45%), but only a slightly smaller percentage felt that it had improved (41%).
Looking within categories, the big-box specialty retailers were the most pessimistic, with nearly two-thirds thinking it had gotten worse, followed by one-half of grocery respondents. Those least likely to say things had got worse were small-box specialty retailers, with 45 percent thinking the situation had improved.

Major Shrink Category. The next question was interested in finding out what respondents consider the biggest problem they currently face. To do this, we gave the audience four widely recognized categories of loss—internal theft, external theft, process failure, and vendor fraud.
This question generated some fascinating data. The largest proportion of respondents felt that internal theft was their biggest challenge (46%), closely followed by process failures (38%), with external theft only selected by 14 percent of those taking part. There were also big variations by type of retailer, with 60 percent of big-box specialty attendees selecting internal theft as their biggest issue, compared with only one-quarter of their small-box colleagues (25%).
This data is interesting, not the least because traditionally, external theft has tended to dominate the shrinkage agenda both in terms of technology development, such as CCTV and EAS, and expenditure, but also in terms of prioritization. Additionally, process failures have never been this highly represented in the NRSS survey as such a large problem. What this data suggests is that the issues of internal theft and process failure are now being recognized as key areas of concern and may therefore begin to generate greater attention and prioritization.
LP Budgets. We then went on to ask whether respondents felt that they were continuing to get the same level of budgetary support as the previous year, or whether it had improved or gotten worse.


Two interesting differences were also generated in terms of the position held by the respondent. First, the majority of corporate security managers felt that their budget had increased, while only 25 percent of those who described themselves as field staff thought that this was the case. There would seem to be a significant difference between how senior managers are perceiving budgets, and those further down the line. Could it be that the extra income isn’t being felt further down the line? This may suggest that any increase in spending is being used on capital or corporate projects, rather than payroll support.
Second, the group that is seeing the biggest increase in budget is the safety and risk management respondents. This may indicate a greater corporate commitment to this area, a higher loss history, or, perhaps, an increase related to business continuity planning.
Emerging Issues
The final part of the presentation focused on what the audience thought were emerging issues for the industry. The first area addressed was business continuity.
Business Continuity. The audience was asked how well they thought their businesses were doing in terms of having a business continuity plan. Three options were offered:
- My organization has a well-developed plan that has been rolled out and tested.
- My organization has basic crisis management protocols in place and is continuing to work on the continuity piece.
- My organization has basic crisis management protocols in place, but has not done much on business continuity preparedness (BCP).
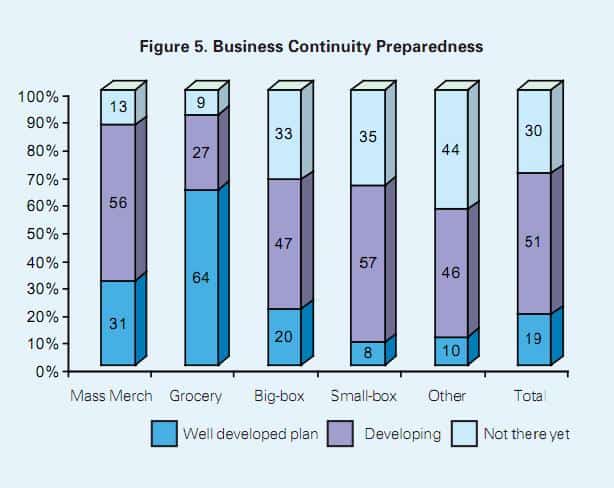
Overall, relatively few respondents (19%) indicated that they had a well-developed plan that was tried and tested (See Figure 5). The majority did say that they had some basic plans in place and that they were continuing to develop their BCP capability. Perhaps more significantly, one-third of those taking part said that while they had basic plans in place, little or no work had been done on BCP. These results do mirror the authors’ experience as they talk to companies around the globe; organizations have the issue on their radar, but have not made much progress to this point.
Within the different retail sectors, the grocery retailers seemed to be the most prepared with two-thirds having a well-developed BCP plan. This might in part be due to the recent concerns about security of the food supply as a national safety issue and recent outbreaks of salmonella that have forced grocers to address this issue in a more focused manner.
Organized Retail Crime. The second area to be explored was organized retail crime (ORC), an issue that has increasingly dominated the loss prevention agenda in the U.S. for the past few years. Two questions were asked of the session attendees—how big an issue it is for them and what percentage of external theft they think is due to ORC.
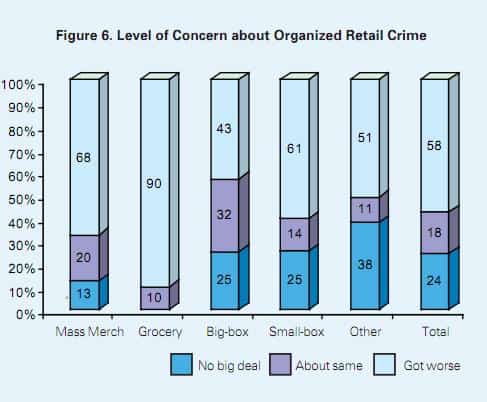
The majority of those attending the session thought that the problem had gotten worse (58%), with an additional 18 percent thinking it had stayed about the same, while one-quarter were of the view that it was no big deal to their businesses.
There was a dramatic difference between types of retailer, however. Ninety percent of grocers thought it was getting worse, followed by 68 percent of mass merchandisers. Both big- and small-box speciality retailers were less unequivocal, although the largest proportion of those expressing an opinion still felt it was getting worse.
In terms of position in the company, security/risk managers were the most likely to think it was getting worse (73%), while field staff were the least likely with 31 percent thinking it was no big deal.
The second question then asked about the percentage ORC contributes to total external theft losses.

The majority of respondents felt that ORC made up less than one-quarter of all external losses, with nearly one-third thinking that it may account for as much as half of external losses. Only a relatively small number of respondents felt that ORC accounted for more than 75 percent of losses caused by external theft.
Within retail categories, the most interesting finding was that while 90 percent of grocers said that ORC had gotten dramatically worse in recent years, 60 percent of them still thought it only accounted for less than 25 percent of their external theft losses. This would suggest caution needs to be exercised in deciding how to address the issue from a budgetary perspective.
Conclusions
As mentioned at the beginning of this article, considerable caution needs to be taken when interpreting and using this data, but it has proved to be an interesting experiment in capturing a snapshot of how the industry is thinking around a number of limited themes. The time lag between the major retail shrinkage surveys can be considerable, and they can also, for the sake of continuity, be relatively inflexible in the questions that are asked. This more “rough-and-ready” approach to offering the industry benchmarks could prove to be an interesting addition to the ongoing quest to measure business performance.
We also found that the grouping of retail formats into a few large buckets may be more helpful in teasing out differences rather than narrowly defining them based on product line or particular market niches.
Finally, we hope this exercise generates ongoing interest in supporting the work of research in the field of retail loss prevention and assets protection. Several interesting questions have been generated by this exercise, and it would be a lost opportunity if they are not explored in further depth to understand causality and possible solutions.